Eddy’s HR Mavericks Encyclopedia
The world's largest free encyclopedia of HR, with 700+ HR articles and podcasts.
Created by Eddy and our HR Mavericks community.
Organizational Chart
There's no need to panic when someone asks to see the org chart and you don’t have one yet. Here are some quick types, tools and steps to create a perfect org chart for your organization.
What Is an Organizational Chart?
An organizational chart, most commonly referred to as an org chart, is a visual depiction of the employees within a group, their hierarchical or reporting functions, and their positions. The org chart is a graphic that features shapes (such as a square for each person per role) with connecting lines (for a direct reporting structure) or dotted lines (to reflect an indirect reporting structure). This allows you to quickly visualize a complete department or organization and all of the people/positions that compose the structure.
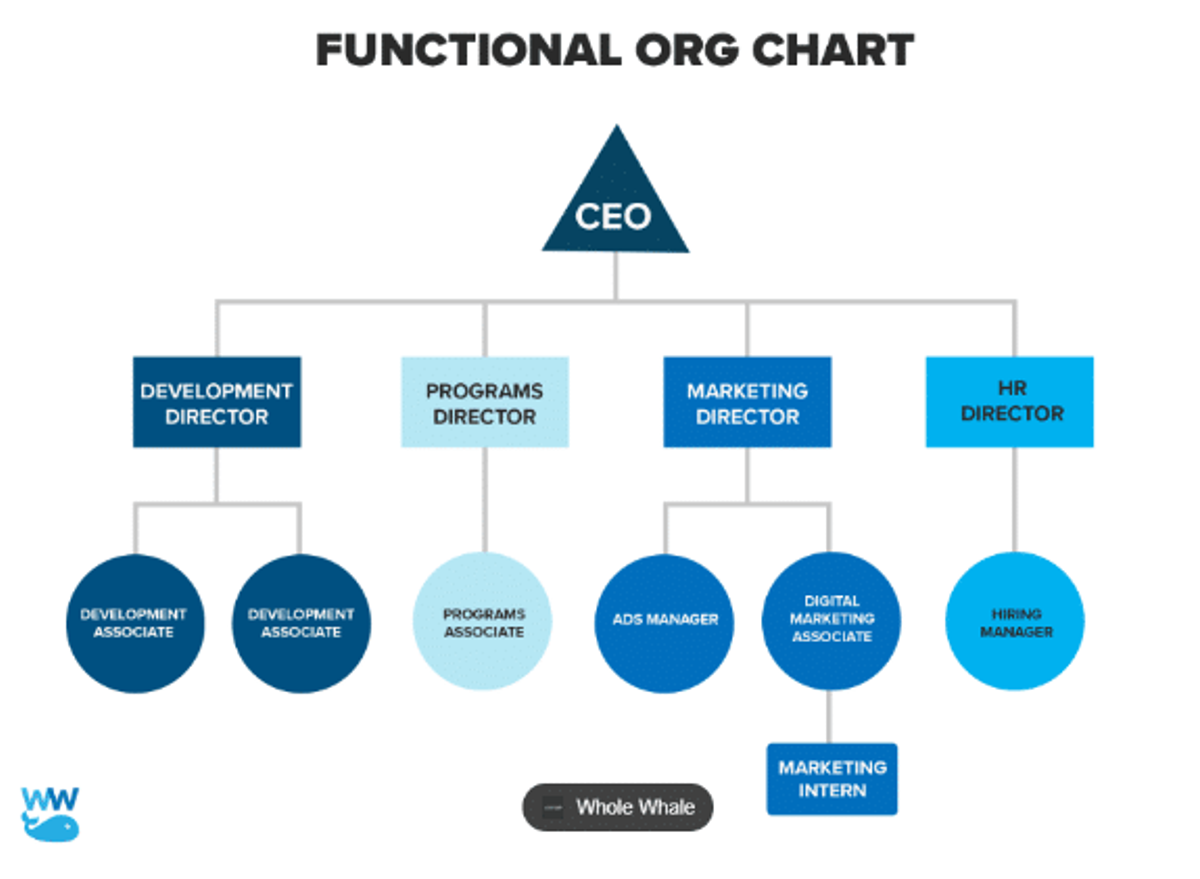
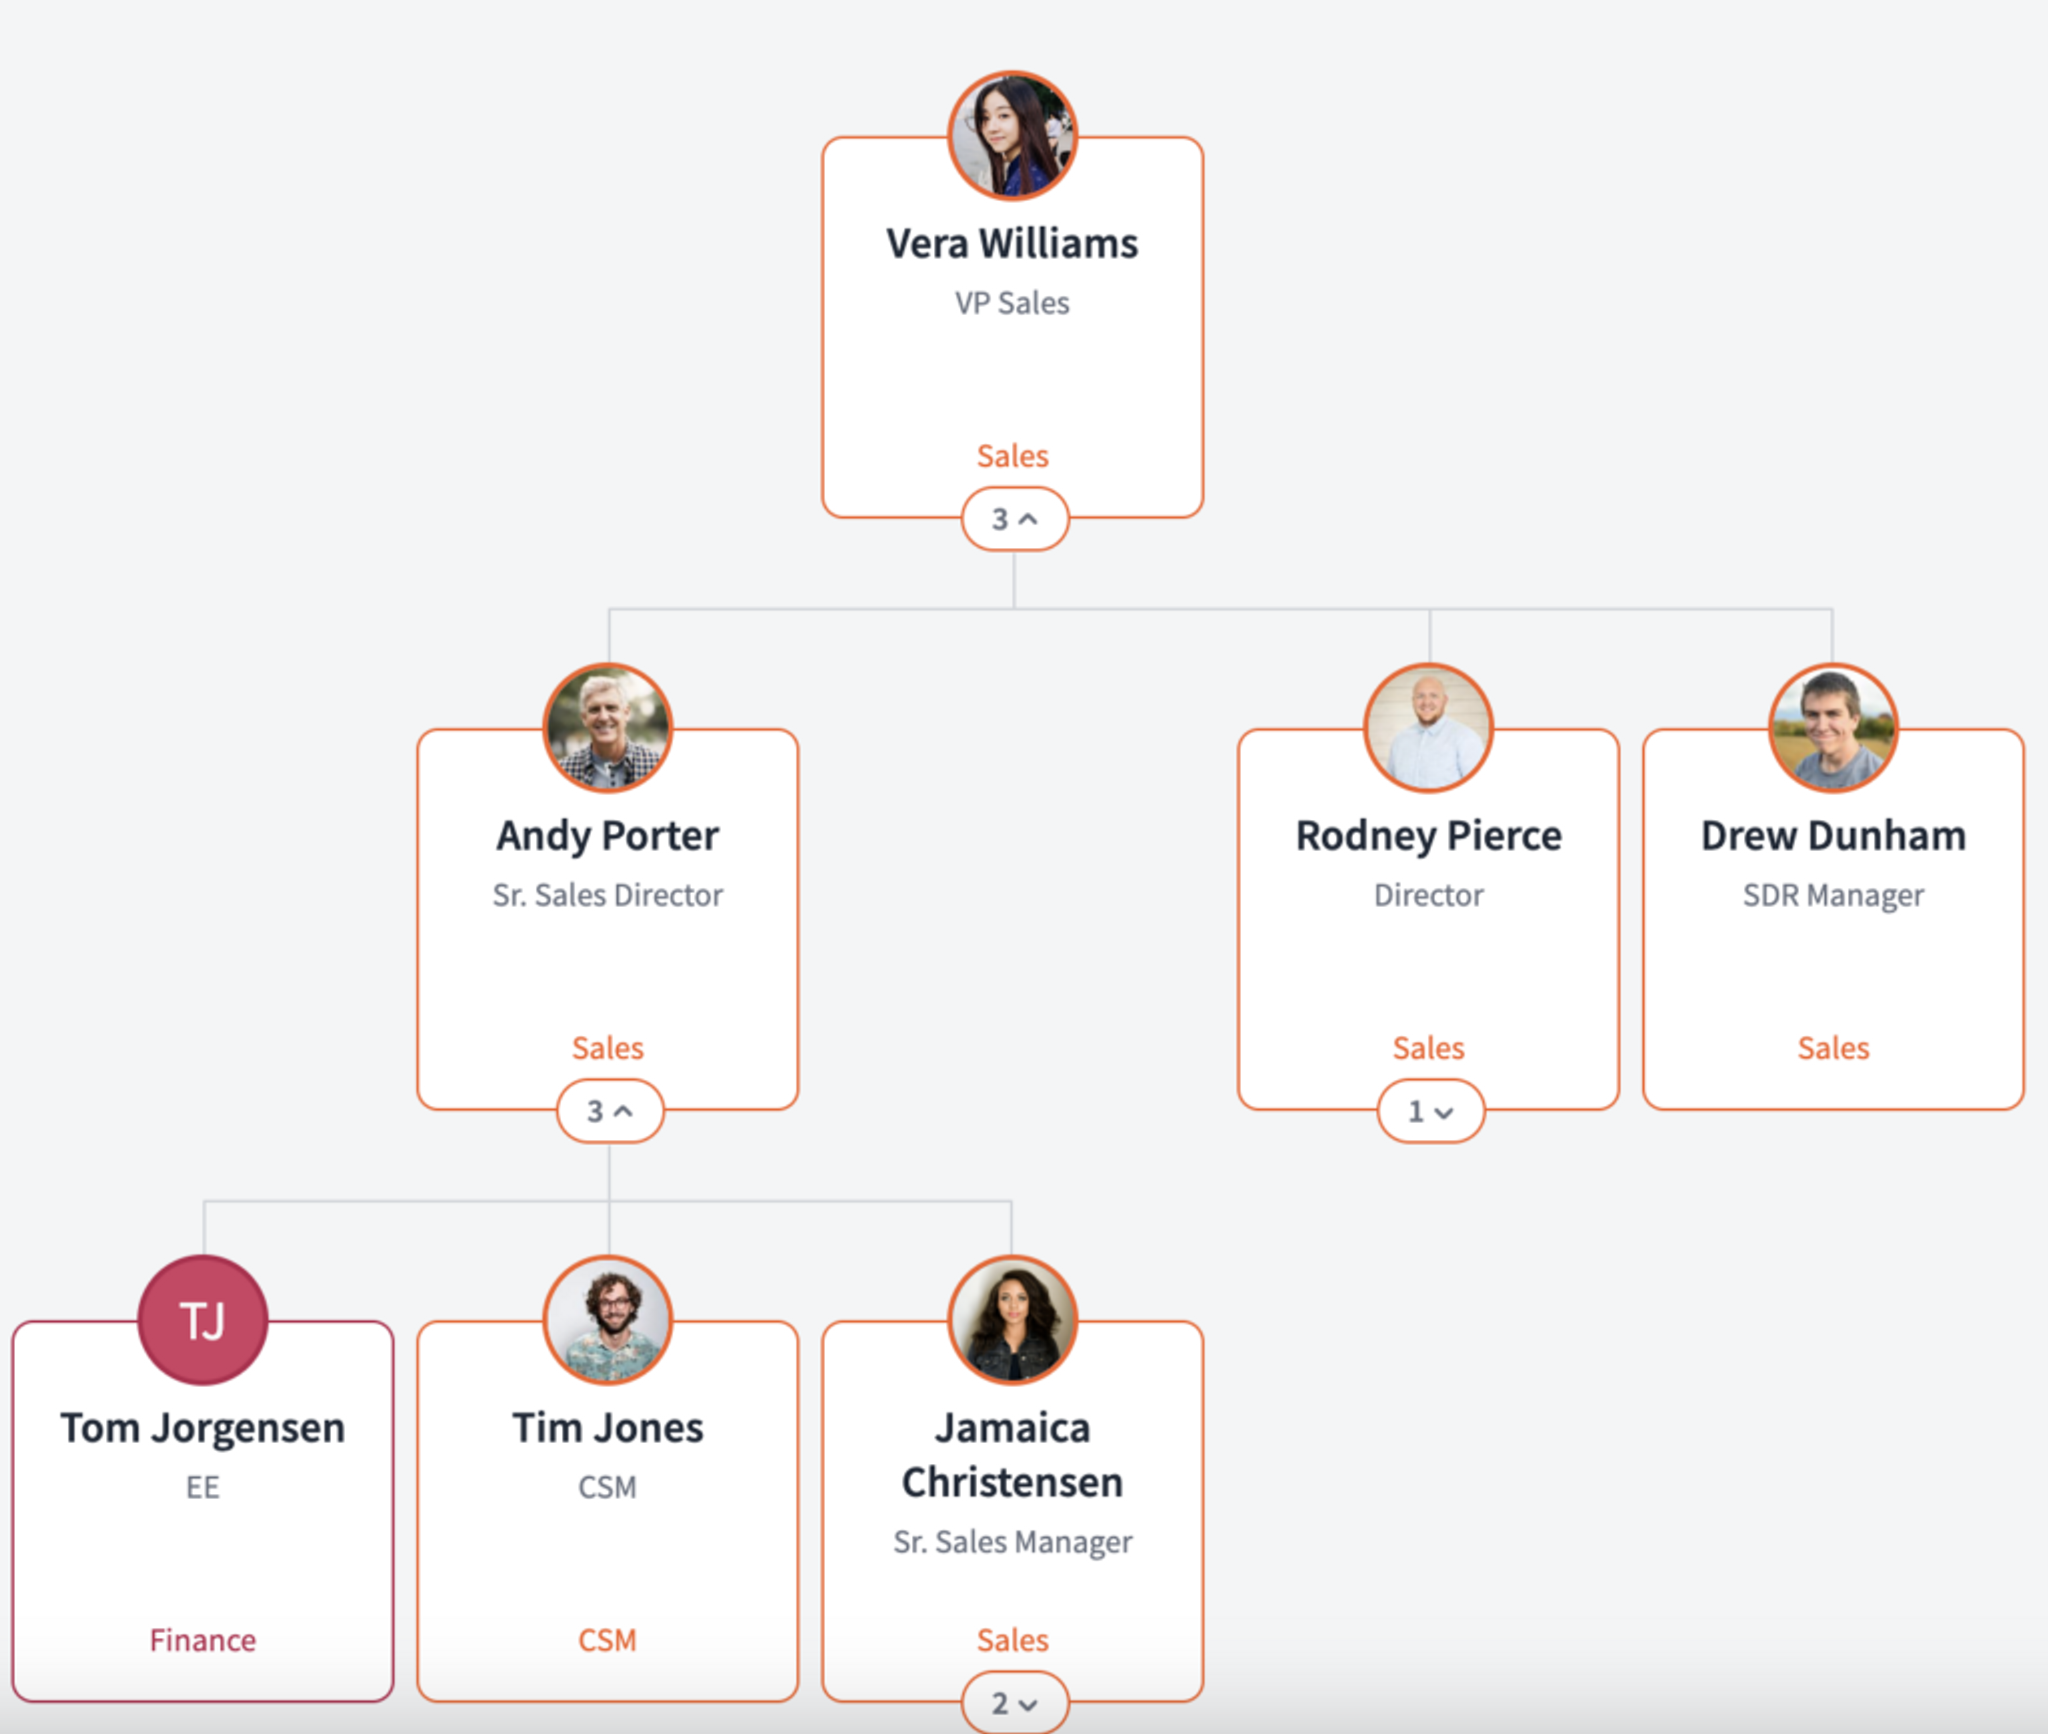
This is an example of an org chart. The CEO is at the top because they have the most responsibility and are the most senior-level position. The lines connecting the department boxes show that the Development Director, Programs Director, Marketing Director and HR Director report directly to the CEO and that each Director has one or two direct reports. Often org charts are created for each department to show all of the individuals that work within the department, their titles, and the reporting structure, as seen below.

This org chart indicates that the CEO, Smith, has five direct reports, and each of the direct reports (John, Peter, Michael, Dany, and Clara) have two direct reports of their own. You can personalize org charts with whatever information you like, from photos to date of hire, location or contact information.
Why Are Organizational Charts Important?
Organizational charts serve a number of purposes. Org charts are beneficial to the business because they:
- Provide a quick, visible reference of the organizational structure and hierarchy. Org charts identify department and reporting structures. They also allow readers to easily locate contacts; for instance, who is the department chair?
- Identify current job openings. Recruiters and hiring managers use this frequently to view their staffing needs.
- Assist with succession management and career progression planning. Leadership can partner with HR to identify potential future incumbents for leadership or higher-level roles, as well as succession management plans (developing personnel to move into the next level). Employees can use org charts as they partner with their managers to plan their career progressions, opportunities, and development plans. By visualizing potential career paths within the organization, an employee can see what levels are between their current and desired roles and how to get there.
Types of Organization Charts
There are three main types of charts: hierarchical, matrix, and flat.
Type 1: Hierarchical
The most common and the easiest to understand type of org chart uses the hierarchical format. It shows the reporting structure from the highest level to the lowest-ranking employee. This is optimal when the reporting structures are clearly defined. Two types of hierarchical org charts include:
- Functional. This is an org chart based on job function and/or department. An example is the graphic image of the CEO’s direct reports in the first example above.
- Divisional. These org charts are based on independent product lines or regions. An international business might want separate org charts of their US-based offices vs. their European ones. An automobile producer may divide org charts by their truck division, car division, and SUV division.
Type 2: Matrix
The matrix organizational reporting structure is increasing in popularity but can be difficult to visualize. It's useful in picturing more complex reporting structures where people work across departments and report to multiple managers. An example would be an HR Business Partner (HRBP) who works within HR to support the call center, distribution center, and finance department. This HRBP may report to the VP of HR, but may also have a senior leader they report to for each of the three functions (call center, distribution center, and finance department).
Type 3: Flat (aka Horizontal)
Flat or horizontal organizational structures are fairly simple and illustrate a few leadership levels between the general employee base and executives. These are not commonly used except in small business environments or instances of one large team that reports to one manager who reports to the CEO.
How to Create an Organization Chart
There are three basic steps to creating and maintaining an org chart.
Step 1: Decide on Scope
Choose which type of org chart you need and the scope you want to illustrate. Do you want to see your organization at a glance, create a functional hierarchical chart focusing on the marketing department, or build a few divisional charts?
Step 2: Select Software
We'll look at four different tools below, but this list is hardly all-inclusive. You can use anything from a pencil to software created only to make org charts. Correlate a shape per employee (example: one rectangle = one employee) and connecting lines to show reporting structures. Organize the people and reporting structures based on the type of org chart you’re creating (hierarchical, matrix, etc).
Step 3: Gather and Organize Accurate Information
An organizational chart is only as useful as the accuracy of its data. Identify who is in which roles and their reporting structures.
Step 4: Proofread, Publish, and Periodically Audit
Ask a few other leaders to review the draft before publishing to make sure everything looks correct. Include the date and time of publishing in the footer to track when it was last updated/which version is current. Make sure to periodically audit your data and update it every time there are changes: promotions, demotions, transfers, hires, separations, supervisor changes, shifts in how the business is structured, etc.
Tools to Make an Organization Chart
Here are four different tools you could use to create your org chart.
Tool 1: Your Current HRIS System
HRIS (Human Resource Information System) software is constantly evolving, and newer software typically offers organizational chart capability. This functionality may come at an additional cost, so double-check the financial impact before electing it. This is the most time-effective and efficient way to manage the data, assuming the data within your HR system is accurate. Typically, the HRIS will update the org chart with any personnel transition or changes to title, reporting structure, department, etc. This is the most recommended format to manage your organizational chart, but only as long as you have data integrity within your HRIS. Eddy's all-in-one HR platform provides a company-wide organizational chart for no additional cost.
Tool 2: Pingboard
Pingboard is a software that starts free but enables most functions at a price. Pingboard can be set up so all employees have access to the software and can easily find information about coworkers. The downside of this software, like most others, is that it can only be manually updated. If you don’t update the software each time a change is made, the org chart will not be accurate. Engineers and technology people typically like using Pingboard, but there’s debate on how user-friendly it really is.
Tool 3: Microsoft Office
If your organization already utilizes Office, you can create org charts for free in PowerPoint, Word, Visio, and possibly more. Microsoft has a lot of resources and training videos to help new users create the structure. Again, data must be manually updated any time there is any change.
Tool 4: Many Other Options
As software and technology evolves, so do our options. There is other software that currently helps with org structures and contact information/directories, and new alternatives arise frequently. As you assess your choices, remember that your time in making manual updates adds to the cost of using the program.
Limitations of Organization Charts
Although undeniably useful, creating org charts is a process that does face drawbacks. Here are a few challenges to navigate.
- Manual updates. Most programs require manual updates. If you don’t update each chart after each change, the org chart will not be accurate. This can be a major investment in staff time.
- Cost. Purchasing software to create the charts also has a financial impact.
- Structural limitations. It's difficult to show matrix or cross-functional teams and indirect reporting structures.
Topics

Melinda Anderson, SPHR, SHRM-SCP, MBA
Melinda is a senior-level people partner and business leader that is passionate about a positive employee experience, healthy company culture and driving DEI. Melinda serves as a positive change ambassador and the first thing you'll notice about her is her true passion for HR. Helping people and improving workplaces are Melinda's purposes in life, in addition to loving every dog possible!
Frequently asked questions
Other Related Terms

Eddy’s HR Mavericks Encyclopedia
Organizational Chart
There's no need to panic when someone asks to see the org chart and you don’t have one yet. Here are some quick types, tools and steps to create a perfect org chart for your organization.
What Is an Organizational Chart?
An organizational chart, most commonly referred to as an org chart, is a visual depiction of the employees within a group, their hierarchical or reporting functions, and their positions. The org chart is a graphic that features shapes (such as a square for each person per role) with connecting lines (for a direct reporting structure) or dotted lines (to reflect an indirect reporting structure). This allows you to quickly visualize a complete department or organization and all of the people/positions that compose the structure.
This is an example of an org chart. The CEO is at the top because they have the most responsibility and are the most senior-level position. The lines connecting the department boxes show that the Development Director, Programs Director, Marketing Director and HR Director report directly to the CEO and that each Director has one or two direct reports. Often org charts are created for each department to show all of the individuals that work within the department, their titles, and the reporting structure, as seen below.
This org chart indicates that the CEO, Smith, has five direct reports, and each of the direct reports (John, Peter, Michael, Dany, and Clara) have two direct reports of their own. You can personalize org charts with whatever information you like, from photos to date of hire, location or contact information.
Why Are Organizational Charts Important?
Organizational charts serve a number of purposes. Org charts are beneficial to the business because they:
- Provide a quick, visible reference of the organizational structure and hierarchy. Org charts identify department and reporting structures. They also allow readers to easily locate contacts; for instance, who is the department chair?
- Identify current job openings. Recruiters and hiring managers use this frequently to view their staffing needs.
- Assist with succession management and career progression planning. Leadership can partner with HR to identify potential future incumbents for leadership or higher-level roles, as well as succession management plans (developing personnel to move into the next level). Employees can use org charts as they partner with their managers to plan their career progressions, opportunities, and development plans. By visualizing potential career paths within the organization, an employee can see what levels are between their current and desired roles and how to get there.
Types of Organization Charts
There are three main types of charts: hierarchical, matrix, and flat.
Type 1: Hierarchical
The most common and the easiest to understand type of org chart uses the hierarchical format. It shows the reporting structure from the highest level to the lowest-ranking employee. This is optimal when the reporting structures are clearly defined. Two types of hierarchical org charts include:
- Functional. This is an org chart based on job function and/or department. An example is the graphic image of the CEO’s direct reports in the first example above.
- Divisional. These org charts are based on independent product lines or regions. An international business might want separate org charts of their US-based offices vs. their European ones. An automobile producer may divide org charts by their truck division, car division, and SUV division.
Type 2: Matrix
The matrix organizational reporting structure is increasing in popularity but can be difficult to visualize. It's useful in picturing more complex reporting structures where people work across departments and report to multiple managers. An example would be an HR Business Partner (HRBP) who works within HR to support the call center, distribution center, and finance department. This HRBP may report to the VP of HR, but may also have a senior leader they report to for each of the three functions (call center, distribution center, and finance department).
Type 3: Flat (aka Horizontal)
Flat or horizontal organizational structures are fairly simple and illustrate a few leadership levels between the general employee base and executives. These are not commonly used except in small business environments or instances of one large team that reports to one manager who reports to the CEO.
How to Create an Organization Chart
There are three basic steps to creating and maintaining an org chart.
Step 1: Decide on Scope
Choose which type of org chart you need and the scope you want to illustrate. Do you want to see your organization at a glance, create a functional hierarchical chart focusing on the marketing department, or build a few divisional charts?
Step 2: Select Software
We'll look at four different tools below, but this list is hardly all-inclusive. You can use anything from a pencil to software created only to make org charts. Correlate a shape per employee (example: one rectangle = one employee) and connecting lines to show reporting structures. Organize the people and reporting structures based on the type of org chart you’re creating (hierarchical, matrix, etc).
Step 3: Gather and Organize Accurate Information
An organizational chart is only as useful as the accuracy of its data. Identify who is in which roles and their reporting structures.
Step 4: Proofread, Publish, and Periodically Audit
Ask a few other leaders to review the draft before publishing to make sure everything looks correct. Include the date and time of publishing in the footer to track when it was last updated/which version is current. Make sure to periodically audit your data and update it every time there are changes: promotions, demotions, transfers, hires, separations, supervisor changes, shifts in how the business is structured, etc.
Tools to Make an Organization Chart
Here are four different tools you could use to create your org chart.
Tool 1: Your Current HRIS System
HRIS (Human Resource Information System) software is constantly evolving, and newer software typically offers organizational chart capability. This functionality may come at an additional cost, so double-check the financial impact before electing it. This is the most time-effective and efficient way to manage the data, assuming the data within your HR system is accurate. Typically, the HRIS will update the org chart with any personnel transition or changes to title, reporting structure, department, etc. This is the most recommended format to manage your organizational chart, but only as long as you have data integrity within your HRIS. Eddy's all-in-one HR platform provides a company-wide organizational chart for no additional cost.
Tool 2: Pingboard
Pingboard is a software that starts free but enables most functions at a price. Pingboard can be set up so all employees have access to the software and can easily find information about coworkers. The downside of this software, like most others, is that it can only be manually updated. If you don’t update the software each time a change is made, the org chart will not be accurate. Engineers and technology people typically like using Pingboard, but there’s debate on how user-friendly it really is.
Tool 3: Microsoft Office
If your organization already utilizes Office, you can create org charts for free in PowerPoint, Word, Visio, and possibly more. Microsoft has a lot of resources and training videos to help new users create the structure. Again, data must be manually updated any time there is any change.
Tool 4: Many Other Options
As software and technology evolves, so do our options. There is other software that currently helps with org structures and contact information/directories, and new alternatives arise frequently. As you assess your choices, remember that your time in making manual updates adds to the cost of using the program.
Limitations of Organization Charts
Although undeniably useful, creating org charts is a process that does face drawbacks. Here are a few challenges to navigate.
- Manual updates. Most programs require manual updates. If you don’t update each chart after each change, the org chart will not be accurate. This can be a major investment in staff time.
- Cost. Purchasing software to create the charts also has a financial impact.
- Structural limitations. It's difficult to show matrix or cross-functional teams and indirect reporting structures.
Topics

Melinda Anderson, SPHR, SHRM-SCP, MBA
Melinda is a senior-level people partner and business leader that is passionate about a positive employee experience, healthy company culture and driving DEI. Melinda serves as a positive change ambassador and the first thing you'll notice about her is her true passion for HR. Helping people and improving workplaces are Melinda's purposes in life, in addition to loving every dog possible!
Frequently asked questions
Other Related Terms
Eddy's HR Newsletter
Sign up for our email newsletter for helpful HR advice and ideas.